Getting Started
To start the app, double-click on the provided executable.
This software runs both in the RCC and in the Vessel.
Main Screens and Navigation
The iField starting screen is the Project Overview. It contains all the projects that were created.
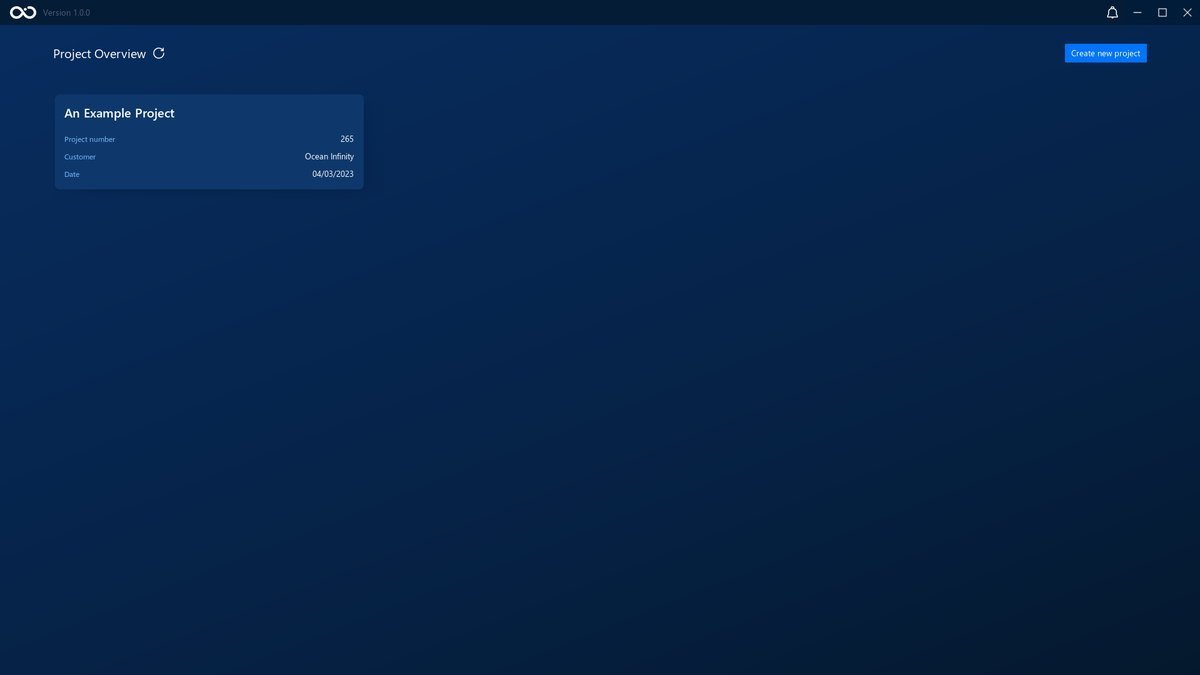
You can navigate to a project from this screen by clicking on one of the project cards.
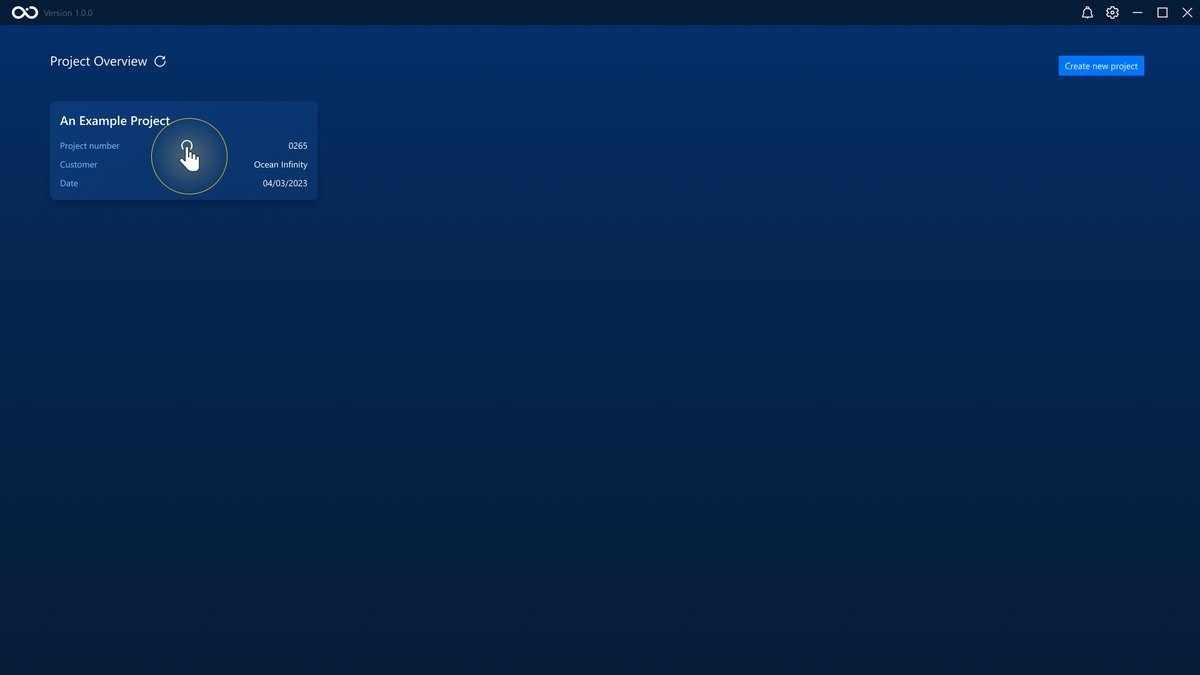
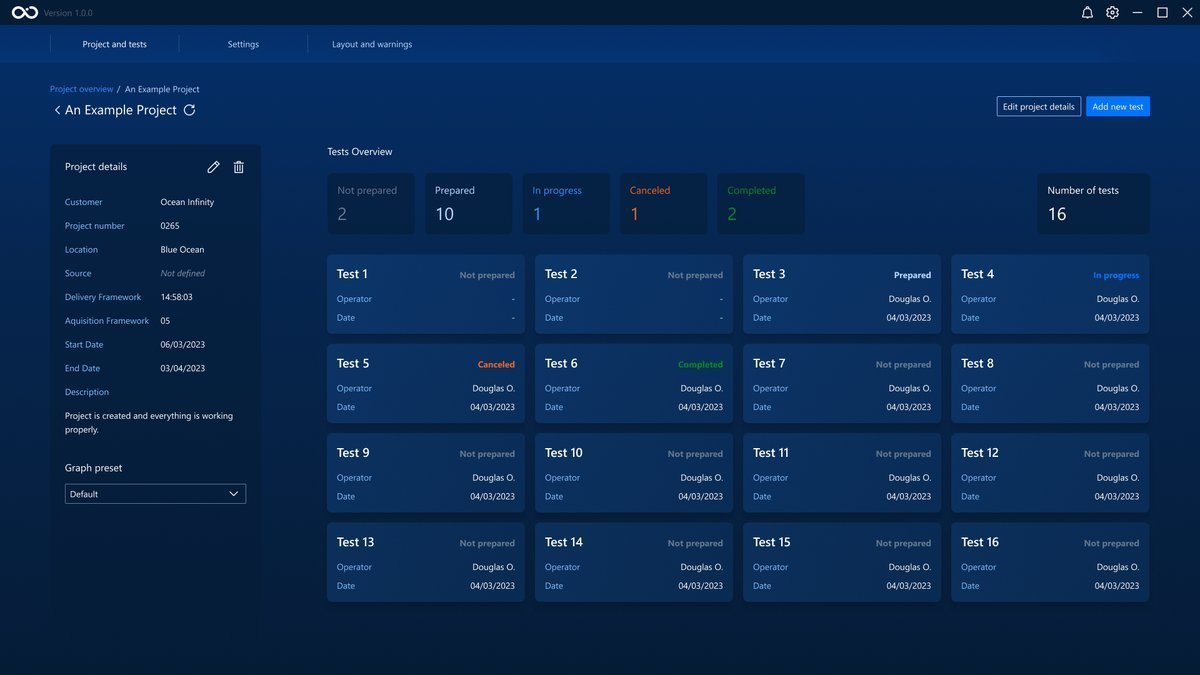
You are taken to the Project Dashboard. This contains all information about the project and the tests that belong to this project. (Projects)
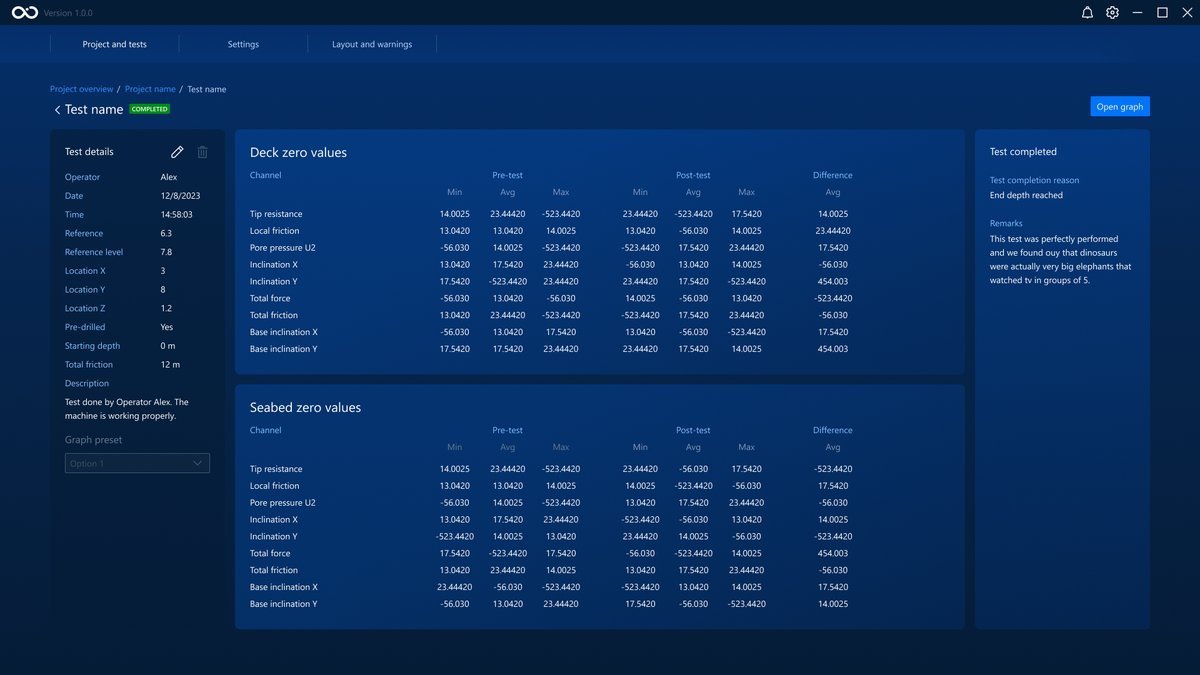
To see a Test, click on its card. You will be taken to the Test Dashboard. The following image shows a Test Dashboard of a test that's Completed. On this page, you can see the Zero Measurements that were done and the test's details. (Tests)
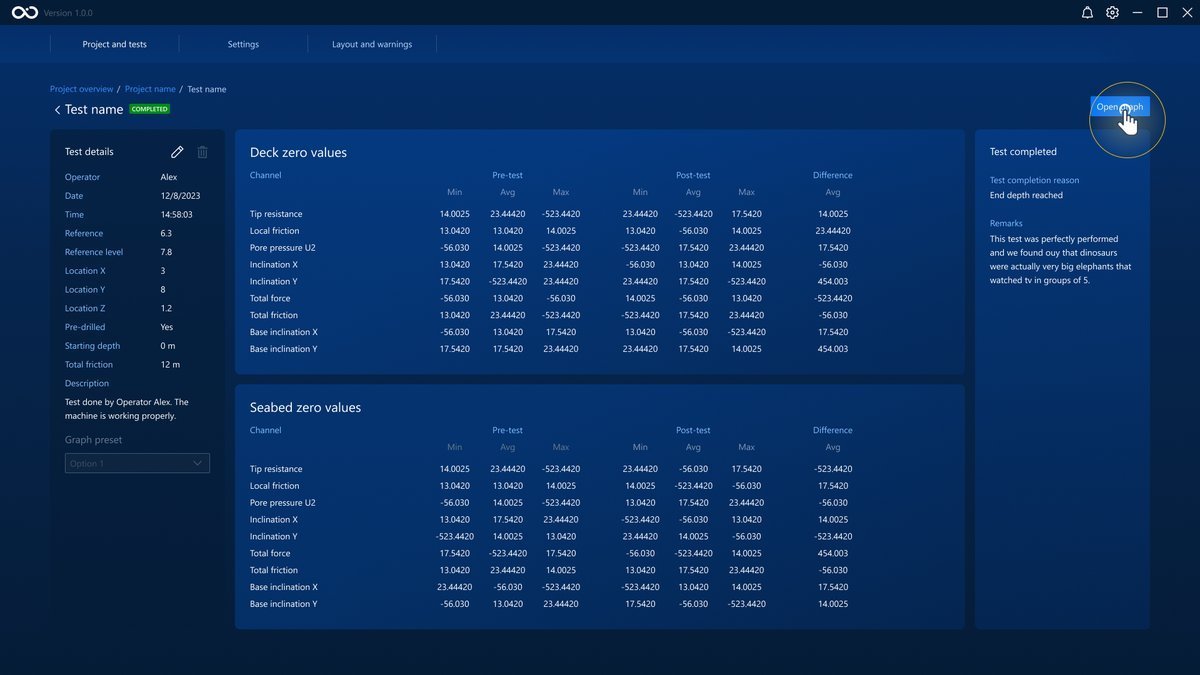
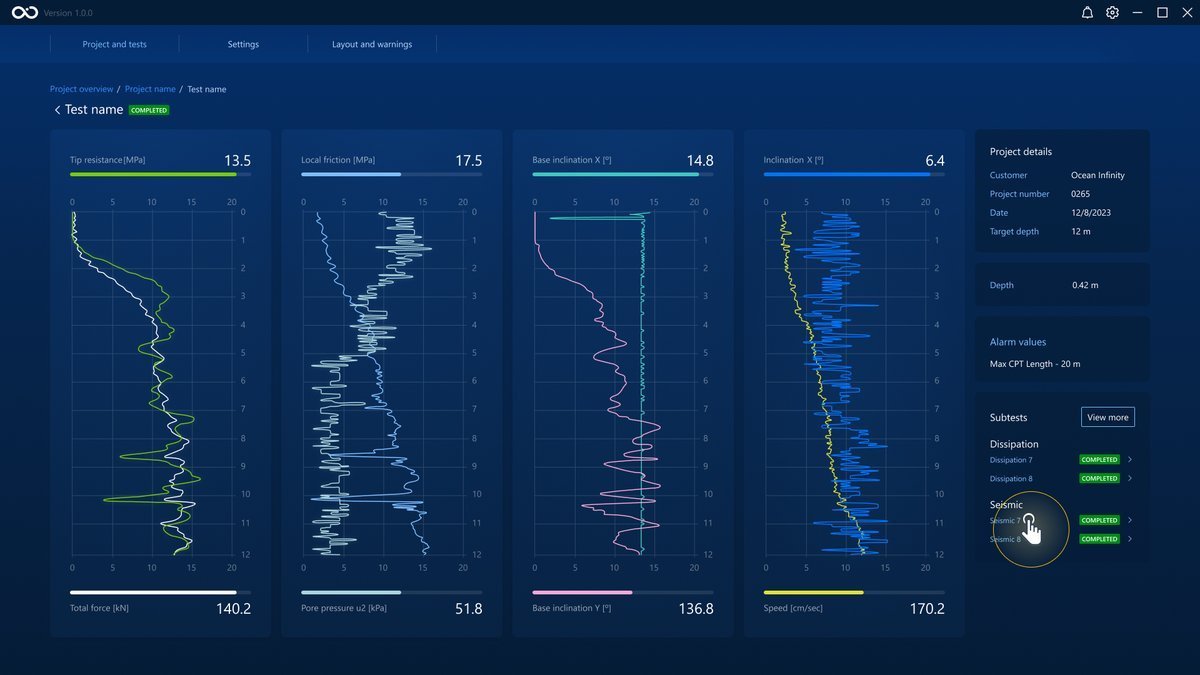
To access the data taken in the rest of the test, click on the Open graph . This will take you to the Test Graphs page.
On this page, you can see all the collected data plotted against depth. (Data Acquisiton)
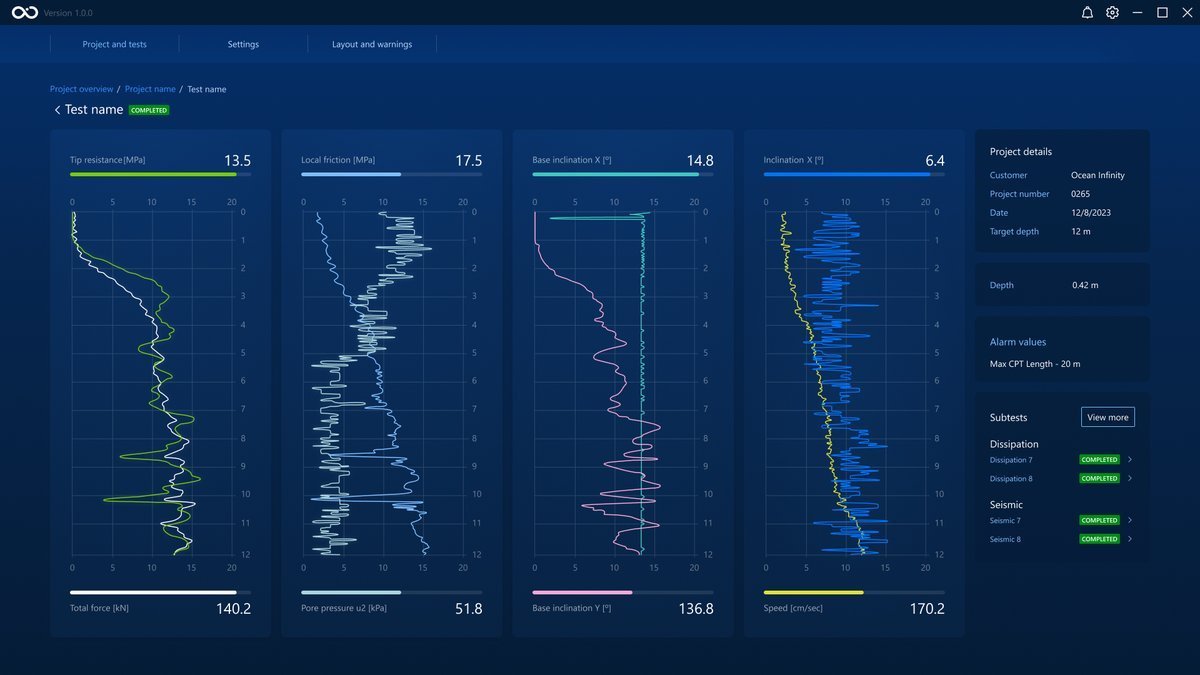
You can see the subtests made during the test in the Subtests panel at the bottom right. To see a subtest, click on its name.
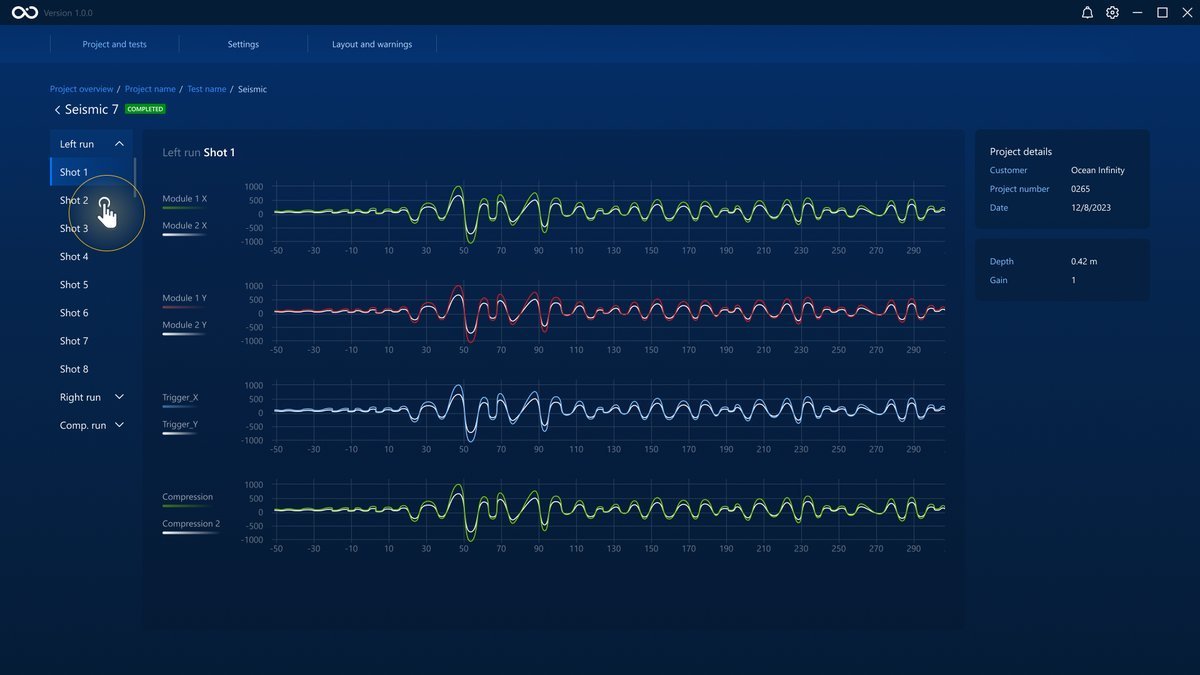
This will take you to the Subtest Graph page. On this page, you can see the data collected for the subtests, and in case of a seismic subtest, you can see the different shots that were done. (Subtests)